You are looking at the documentation of a prior release. To read the documentation of the latest release, please
visit here.
New to KubeVault? Please start here.
Monitor Vault server with builtin Prometheus scraper
This tutorial will show you how to configure builtin Prometheus scraper to monitor Vault server provisioned by the KubeVault operator.
The prometheus server is needed to configure so that it can discover endpoints of Kubernetes services. If a Prometheus server is already running in cluster and if it is configured in a way that it can discover service endpoints, no extra configuration will be needed.Otherwise, read this tutorial to deploy a Prometheus server with appropriate configuration.
Create the following configmap with Prometheus configuration and pass it to a Prometheus server.
apiVersion: v1
kind: ConfigMap
metadata:
  name: prometheus-server-conf
  labels:
    name: prometheus-server-conf
  namespace: demo
data:
  prometheus.yml: |-
    global:
      scrape_interval: 5s
      evaluation_interval: 5s
    scrape_configs:
    - job_name: 'kubernetes-service-endpoints'

      kubernetes_sd_configs:
      - role: endpoints

      relabel_configs:
      - source_labels: [__meta_kubernetes_service_annotation_prometheus_io_scrape]
        action: keep
        regex: true
      - source_labels: [__meta_kubernetes_service_annotation_prometheus_io_scheme]
        action: replace
        target_label: __scheme__
        regex: (https?)
      - source_labels: [__meta_kubernetes_service_annotation_prometheus_io_path]
        action: replace
        target_label: __metrics_path__
        regex: (.+)
      - source_labels: [__address__, __meta_kubernetes_service_annotation_prometheus_io_port]
        action: replace
        target_label: __address__
        regex: ([^:]+)(?::\d+)?;(\d+)
        replacement: $1:$2
      - action: labelmap
        regex: __meta_kubernetes_service_label_(.+)
      - source_labels: [__meta_kubernetes_namespace]
        action: replace
        target_label: kubernetes_namespace
      - source_labels: [__meta_kubernetes_service_name]
        action: replace
        target_label: kubernetes_name
      - source_labels: [__meta_kubernetes_pod_name]
        action: replace
        target_label: pod_name
You can create above ConfigMap by running
$ kubectl create -f https://github.com/kubevault/kubevault/raw/v2024.9.30/docs/examples/monitoring/vault-server/prom-server-conf.yaml
configmap/prometheus-server-conf created
Note: YAML files used in this tutorial are stored in docs/examples
Monitor Vault server
To enable monitoring, configure spec.monitor field in a VaultServer custom resource. Below is an example:
apiVersion: kubevault.com/v1alpha1
kind: VaultServer
metadata:
  name: vault
  namespace: demo
spec:
  replicas: 1
  version: 1.2.0
  serviceTemplates:
  - alias: vault
    metadata:
      annotations:
        name: vault
    spec:
      type: NodePort
  - alias: stats
    spec:
      type: ClusterIP
  backend:
    inmem: {}
  unsealer:
    secretShares: 4
    secretThreshold: 2
    mode:
      kubernetesSecret:
        secretName: vault-keys
  monitor:
      agent: prometheus.io
      prometheus:
        exporter:
          resources: {}
  terminationPolicy: "WipeOut"
Here,
spec.monitorspecifies that built-in prometheus is used to monitor this Vault server instance.monitor.prometheusspecifies the information for monitoring by Prometheus.prometheus.portindicates the port for Vault statsd exporter endpoint (default is56790)prometheus.intervalindicates the scraping interval (eg, ’10s')
Run the following command to create it.
$ kubectl create -f https://github.com/kubevault/kubevault/raw/v2024.9.30/docs/examples/monitoring/vault-server/vault-server-builtin.yaml
vaultserver.kubevault.com/example created
KubeVault operator will configure its service once the Vault server is successfully running.
$ kubectl get vs -n demo
NAME      NODES     VERSION   STATUS    AGE
example   1         0.11.1    Running   3h
Let’s describe Service example-stats
$ kubectl get svc -n demo example -o yaml
apiVersion: v1
kind: Service
metadata:
  annotations:
    monitoring.appscode.com/agent: prometheus.io/builtin
    prometheus.io/path: /metrics
    prometheus.io/port: "9102"
    prometheus.io/scrape: "true"
  creationTimestamp: "2018-12-24T11:27:28Z"
  labels:
    app: vault
    vault_cluster: example
  name: example
  namespace: demo
  ownerReferences:
  - apiVersion: kubevault.com/v1alpha1
    controller: true
    kind: VaultServer
    name: example
    uid: e42c20cd-076e-11e9-b586-0800274de81b
  resourceVersion: "1828"
  selfLink: /api/v1/namespaces/demo/services/example
  uid: e5064216-076e-11e9-b586-0800274de81b
spec:
  clusterIP: 10.107.246.170
  externalTrafficPolicy: Cluster
  ports:
  - name: client
    nodePort: 31528
    port: 8200
    protocol: TCP
    targetPort: 8200
  - name: cluster
    nodePort: 32245
    port: 8201
    protocol: TCP
    targetPort: 8201
  - name: prom-http
    nodePort: 30292
    port: 9102
    protocol: TCP
    targetPort: 9102
  selector:
    app: vault
    vault_cluster: example
  sessionAffinity: None
  type: NodePort
status:
  loadBalancer: {}
You can see that the service contains following annotations.
monitoring.appscode.com/agent: prometheus.io/builtin
prometheus.io/path: /metrics
prometheus.io/port: "9102"
prometheus.io/scrape: "true"
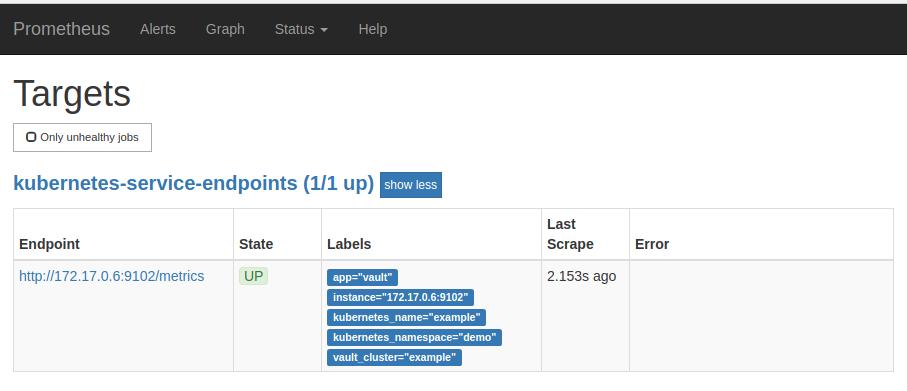
The Prometheus server will discover the Vault service endpoint and will scrape metrics from the exporter sidecar.

Cleaning up
To cleanup the Kubernetes resources created by this tutorial, run:
$ kubectl delete -n demo vs/example
$ kubectl delete ns demo


