


You are looking at the documentation of a prior release. To read the documentation of the latest release, please
visit here.
New to KubeVault? Please start here.
Visualize Vault server data using Grafana dashboard
Grafana provides an elegant graphical user interface to visualize data. You can create beautiful dashboard easily with a meaningful representation of your Prometheus metrics.
If there is no grafana instance running on your cluster, then you can read this tutorial to deploy one.
Add Prometheus Data Source
We have to add our Prometheus server prometheus-prometheus-0 as data source of grafana. We are going to use a ClusterIP service to connect Prometheus server with grafana. Let’s create a service to select Prometheus server prometheus-prometheus-0,
$ kubectl apply -f https://github.com/kubevault/kubevault/raw/v2023.05.05/docs/examples/monitoring/vault-server/prometheus-service.yaml
service/prometheus created
Below the YAML for the service we have created above,
apiVersion: v1
kind: Service
metadata:
  name: prometheus
  namespace: monitoring
spec:
  type: ClusterIP
  ports:
  - name: web
    port: 9090
    protocol: TCP
    targetPort: 9090
  selector:
    app: prometheus
Now, follow these steps to add the Prometheus server as data source of Grafana UI.
From Grafana UI, go to
Configurationoption from sidebar and click onData Sources.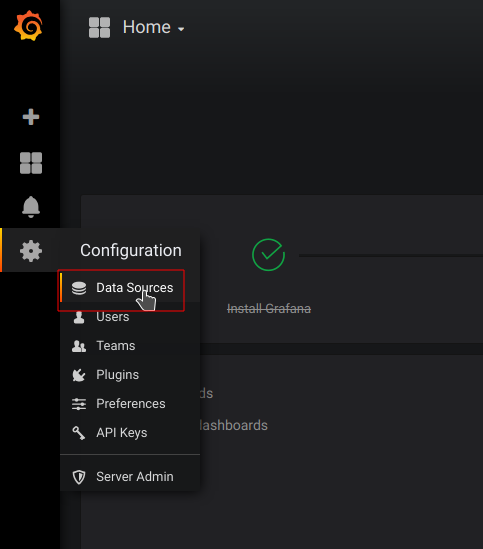
Then, click on
Add data source.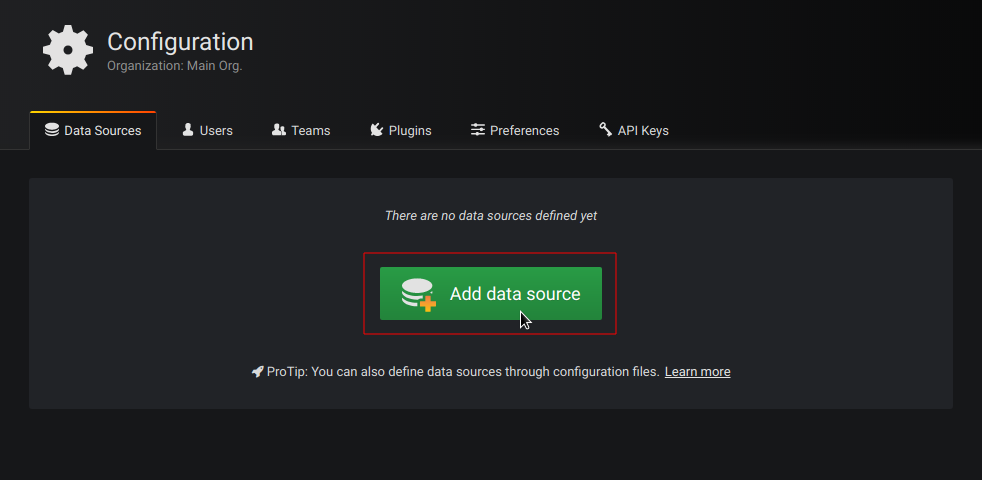
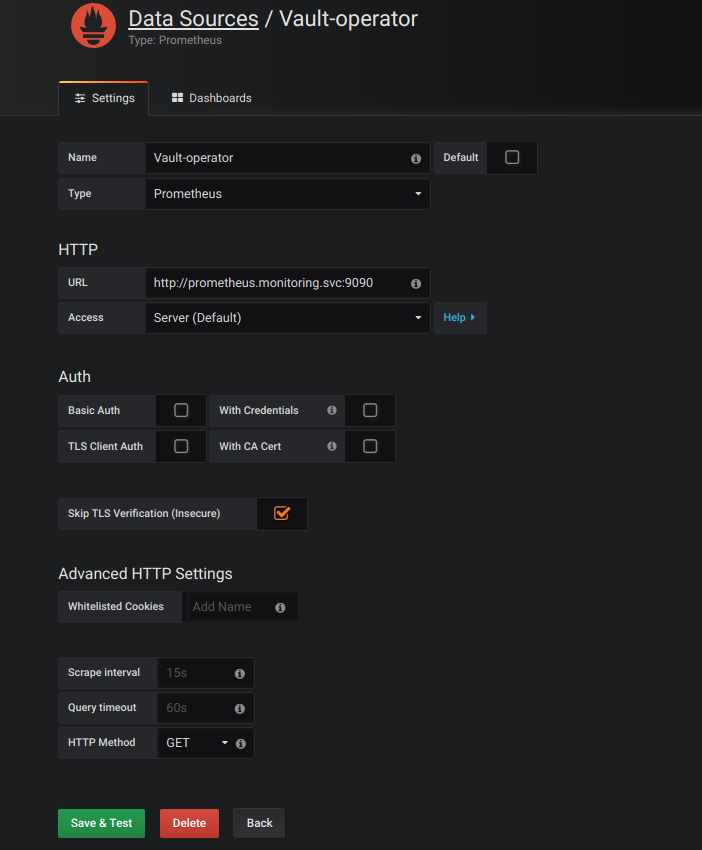
Now, configure
Name,TypeandURLfields as specified below and keep rest of the configuration to their default value then clickSave&Testbutton.- Name: Vault-Operator (you can give any name)
- Type: Prometheus
- URL: http://prometheus.monitoring.svc:9090 (url format: http://{prometheus service name}.{namespace}.svc:{port})
Once you have added Prometheus data source successfully, you are ready to create a dashboard to visualize the metrics.
Import Vault server Dashboard
Vault server comes with a pre-configured Grafana dashboard. You can download json configuration of the dashboard from here.
Follow these steps to import the preconfigured stash dashboard,
From Grafana UI, go to
Createoption from sidebar and click onimport.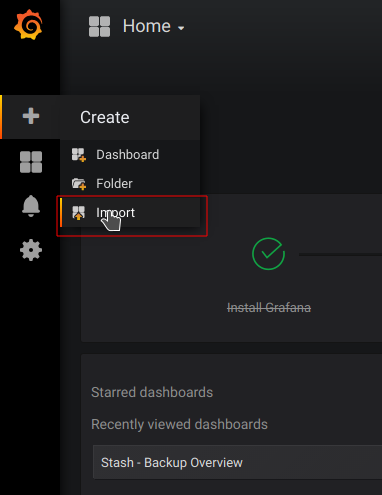
Then, paste
jsonfrom here or uploadjsonconfiguration file of the dashboard usingUpload .json Filebutton.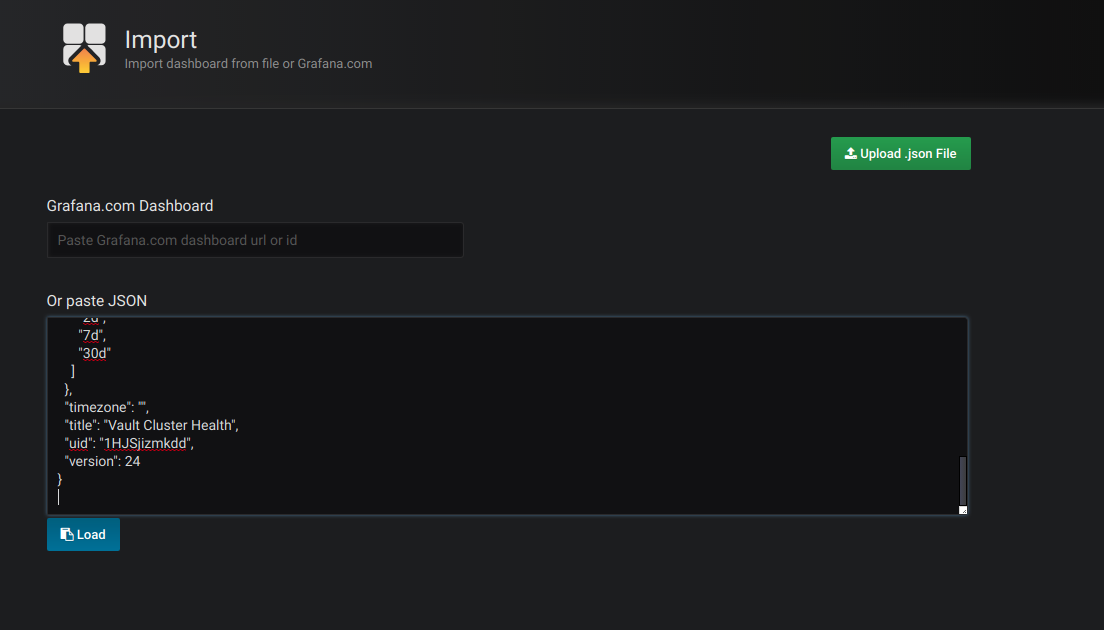
Now on
prometheus-infrafield, select the data source name that we have given to our Prometheus data source earlier. Then click onImportbutton.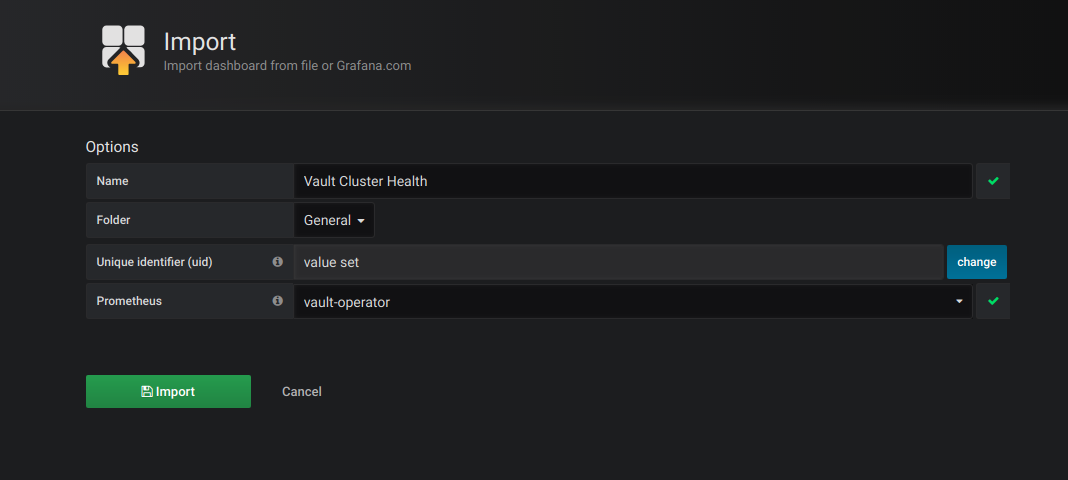
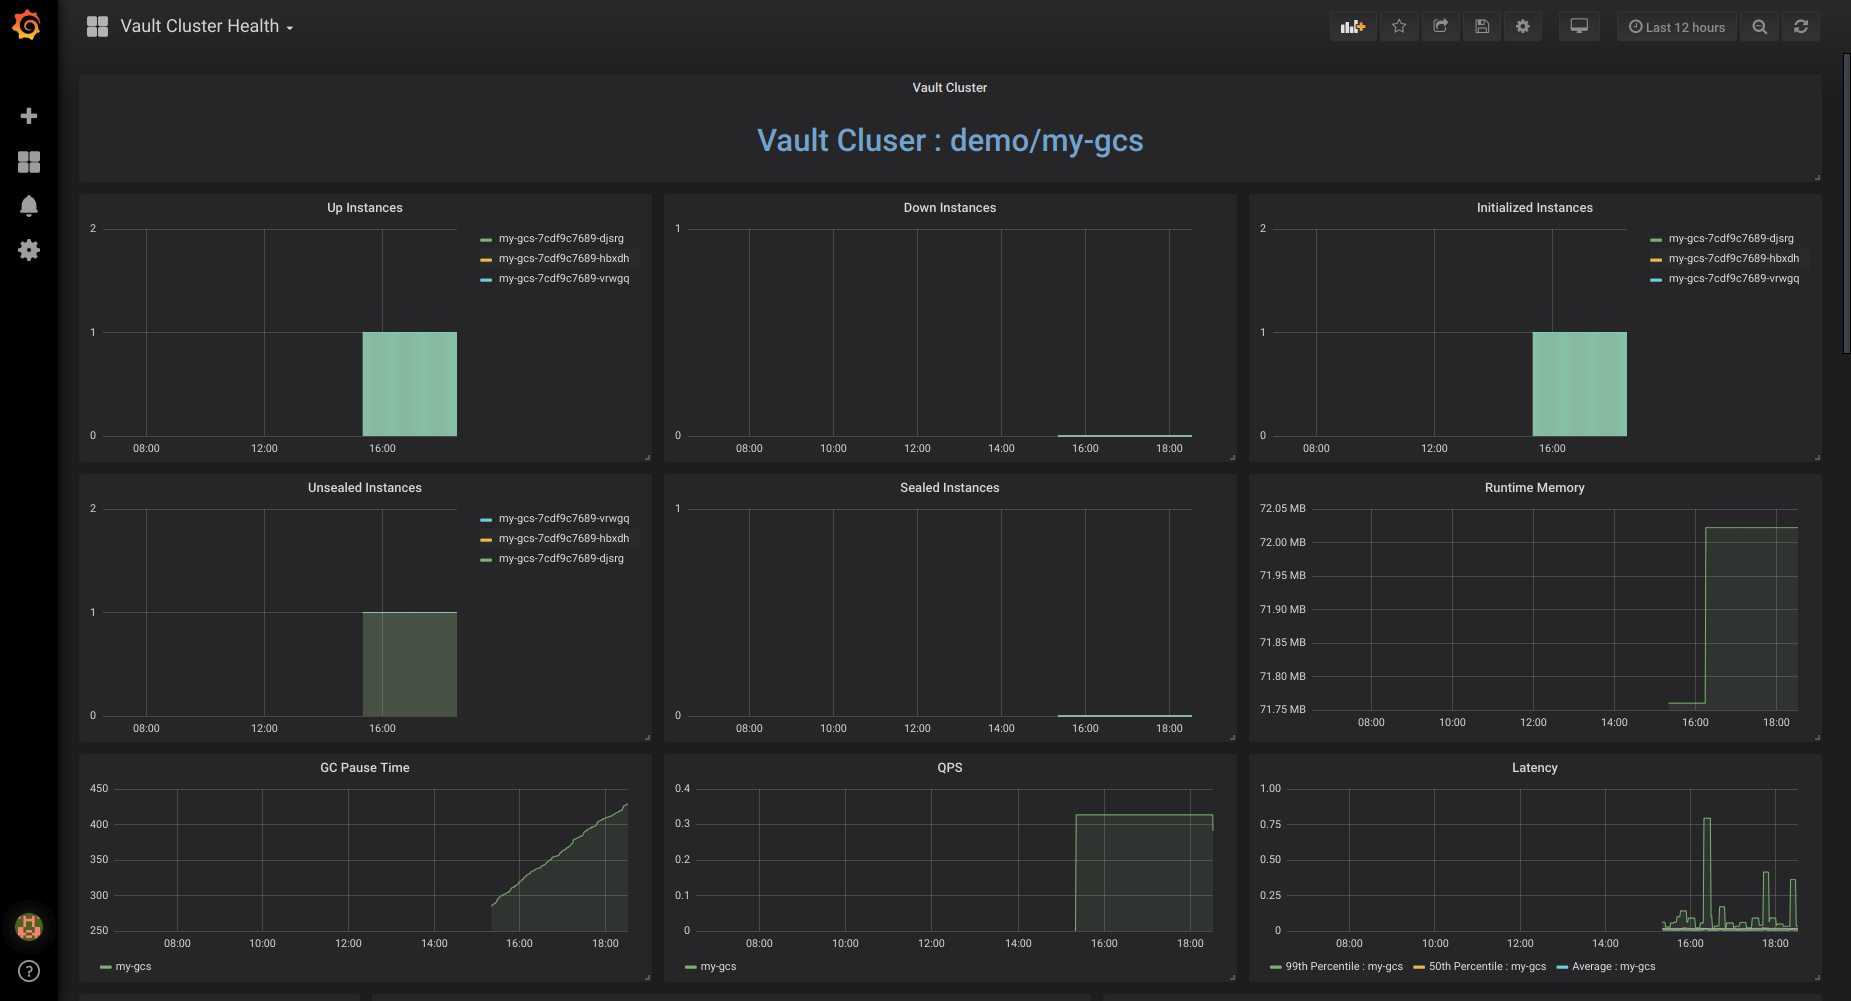
Once you have imported the dashboard successfully, you will be greeted with dashboard.
Cleanup
To cleanup the Kubernetes resources created by this tutorial, run:
kubectl delete -n demo service prometheus