


You are looking at the documentation of a prior release. To read the documentation of the latest release, please
visit here.
New to KubeVault? Please start here.
Monitor KubeVault operator with builtin Prometheus
This tutorial will show you how to configure builtin Prometheus scraper to monitor KubeVault operator.
Before You Begin
At first, you need to have a Kubernetes cluster, and the kubectl command-line tool must be configured to communicate with your cluster. If you do not already have a cluster, you can create one by using kind.
To keep Prometheus resources isolated, we are going to use a separate namespace to deploy Prometheus server.
$ kubectl create ns monitoring
namespace/monitoring created
Enable Monitoring in KubeVault operator
Enable Prometheus monitoring using prometheus.io/builtin annotations while install KubeVault operator. To know details about how to enable monitoring see here
Here, we are going to enable monitoring for operator metrics.
Using Helm 3:
$ helm install vault-operator appscode/vault-operator --version v2022.09.22 \
  --namespace kube-system \
  --set monitoring.agent=prometheus.io/builtin \
  --set monitoring.operator=true \
  --set monitoring.prometheus.namespace=monitoring
Using Helm 2:
$ helm install appscode/vault-operator --name vault-operator --version v2022.09.22 \
  --namespace kube-system \
  --set monitoring.agent=prometheus.io/builtin \
  --set monitoring.operator=true \
  --set monitoring.prometheus.namespace=monitoring
Using YAML (with Helm 3):
$ helm template vault-operator appscode/vault-operator --version v2022.09.22 \
  --namespace kube-system \
  --no-hooks \
  --set monitoring.agent=prometheus.io/builtin \
  --set monitoring.operator=true \
  --set monitoring.prometheus.namespace=monitoring | kubectl apply -f -
This will add necessary annotations to vault-operator service. Prometheus server will scrap metrics using those annotations. Let’s check which annotations are added to the service,
$ kubectl get svc vault-operator -n kube-system -o yaml
apiVersion: v1
kind: Service
metadata:
  annotations:
    prometheus.io/path: /metrics
    prometheus.io/port: "8443"
    prometheus.io/scheme: https
    prometheus.io/scrape: "true"
  creationTimestamp: "2018-12-26T06:12:51Z"
  labels:
    app: vault-operator
    chart: vault-operator-v2022.09.22
    heritage: Tiller
    release: vault-operator
  name: vault-operator
  namespace: kube-system
  resourceVersion: "10030"
  selfLink: /api/v1/namespaces/kube-system/services/vault-operator
  uid: 469d2c8f-08d5-11e9-852c-080027857726
spec:
  clusterIP: 10.110.168.15
  ports:
  - name: api
    port: 443
    protocol: TCP
    targetPort: 8443
  selector:
    app: vault-operator
    release: vault-operator
  sessionAffinity: None
  type: ClusterIP
status:
  loadBalancer: {}
Here, prometheus.io/scrape: "true" annotation indicates that Prometheus should scrap metrics for this service.
The following three annotations point to api endpoints which provides operator specific metrics.
prometheus.io/path: /metrics
prometheus.io/port: "8443"
prometheus.io/scheme: https
Now, we are ready to configure our Prometheus server to scrap those metrics.
Deploy Prometheus Server
We have deployed KubeVault operator in kube-system namespace. KubeVault operator exports operator metrics via TLS secured api endpoint. So, Prometheus server need to provide certificate while scraping metrics from this endpoint. KubeVault operator has created a secret named vault-operator-apiserver-cert with this certificate in monitoring namespaces as we have specified that we are going to deploy Prometheus in that namespace through --prometheus-namespace or monitoring.prometheus.namespace flag. We have to mount this secret in Prometheus deployment.
Let’s check vault-operator-apiserver-cert secret has been created in monitoring namespace.
$ kubectl get  secrets -n monitoring -l=app.kubernetes.io/name=vault-operator
NAME                            TYPE                DATA   AGE
vault-operator-apiserver-cert   kubernetes.io/tls   2      107m
Create RBAC
If you are using a RBAC enabled cluster, you have to provide necessary RBAC permissions for Prometheus. Following this, let’s create RBAC stuffs for Prometheus by running:
$ kubectl apply -f https://github.com/appscode/third-party-tools/raw/master/monitoring/prometheus/builtin/artifacts/rbac.yaml
clusterrole.rbac.authorization.k8s.io/prometheus created
serviceaccount/prometheus created
clusterrolebinding.rbac.authorization.k8s.io/prometheus created
YAML for RBAC resources can be found here.
Create ConfigMap
As we are monitoring KubeVault operator, we should follow this to create a ConfigMap. Bellow the YAML of ConfigMap that we are going to create in this tutorial
apiVersion: v1
kind: ConfigMap
metadata:
  name: prometheus-config
  labels:
    name: prometheus-config
  namespace: monitoring
data:
  prometheus.yml: |-
    global:
      scrape_interval: 5s
      evaluation_interval: 5s
    scrape_configs:
    - job_name: 'vault-apiservers'
      honor_labels: true
      kubernetes_sd_configs:
      - role: endpoints
      # Kubernetes apiserver serve metrics on a TLS secure endpoints. so, we have to use "https" scheme
      scheme: https
      # we have to provide certificate to establish tls secure connection
      tls_config:
        ca_file: /etc/prometheus/secret/vault-operator-apiserver-cert/tls.crt
        server_name: vault-operator.kube-system.svc
      #  bearer_token_file is required for authorizating prometheus server to Kubernetes apiserver
      bearer_token_file: /var/run/secrets/kubernetes.io/serviceaccount/token

      relabel_configs:
      - source_labels: [__meta_kubernetes_service_label_app]
        separator: ;
        regex: vault-operator
        replacement: $1
        action: keep
      - source_labels: [__meta_kubernetes_endpoint_address_target_kind, __meta_kubernetes_endpoint_address_target_name]
        separator: ;
        regex: Node;(.*)
        target_label: node
        replacement: ${1}
        action: replace
      - source_labels: [__meta_kubernetes_namespace, __meta_kubernetes_service_name, __meta_kubernetes_endpoint_port_name]
        action: keep
        regex: kube-system;vault-operator;api
      - separator: ;
        regex: (.*)
        target_label: endpoint
        replacement: api
        action: replace
      - source_labels: [__meta_kubernetes_service_name]
        separator: ;
        regex: (.*)
        target_label: job
        replacement: ${1}
        action: replace
Look at the tls_config field of vault-apiservers job. We have provided certificate file through ca_file field. This certificate comes from vault-operator-apiserver-cert that we are going to mount in Prometheus deployment. Here, server_name is used to verify hostname. In our case, the certificate is valid for hostname server and vault-operator.kube-system.svc.
In relabel_configs section we added <operator_name>.<namespace>.svc:443 as the value of replacement.
Let’s create the ConfigMap we have shown above,
$ kubectl apply -f https://github.com/kubevault/kubevault/raw/v2022.09.22/docs/examples/monitoring/vault-operator/prom-server-conf.yaml
configmap/prometheus-config created
Deploy Prometheus
Now, we are ready to deploy Prometheus server. YAML for the deployment that we are going to create for Prometheus is shown below.
apiVersion: apps/v1
kind: Deployment
metadata:
  labels:
    app: prometheus-demo
  name: prometheus
  namespace: monitoring
spec:
  replicas: 1
  selector:
    matchLabels:
      app: prometheus
  template:
    metadata:
      labels:
        app: prometheus
    spec:
      containers:
      - args:
        - --config.file=/etc/prometheus/prometheus.yml
        - --storage.tsdb.path=/prometheus/
        image: prom/prometheus:v2.5.0
        imagePullPolicy: IfNotPresent
        name: prometheus
        ports:
        - containerPort: 9090
          protocol: TCP
        volumeMounts:
        - mountPath: /etc/prometheus/
          name: prometheus-config
        - mountPath: /prometheus/
          name: prometheus-storage
        - mountPath: /etc/prometheus/secret/vault-operator-apiserver-cert
          name: vault-operator-apiserver-cert
      serviceAccountName: prometheus
      volumes:
      - configMap:
          defaultMode: 420
          name: prometheus-config
        name: prometheus-config
      - emptyDir: {}
        name: prometheus-storage
      - name: vault-operator-apiserver-cert
        secret:
          defaultMode: 420
          secretName: vault-operator-apiserver-cert
          items:
          - path: tls.crt
            key: tls.crt
Notice that, we have mounted vault-operator-apiserver-cert secret as a volume at /etc/prometheus/secret/vault-operator-apiserver-cert directory.
Now, let’s create the deployment,
$ kubectl apply -f https://github.com/kubevault/kubevault/raw/v2022.09.22/docs/examples/monitoring/vault-operator/prom-builtin-deployment.yaml
deployment.apps "prometheus" deleted
Verify Monitoring Metrics
Prometheus server is running on port 9090. We are going to use port forwarding to access Prometheus dashboard. Run following commands on a separate terminal,
$ kubectl get pod -n monitoring -l=app=prometheus
NAME                          READY   STATUS    RESTARTS   AGE
prometheus-8568c86d86-vpzx5   1/1     Running   0          102s

$ kubectl port-forward -n monitoring prometheus-8568c86d86-vpzx5  9090
Forwarding from 127.0.0.1:9090 -> 9090
Forwarding from [::1]:9090 -> 9090
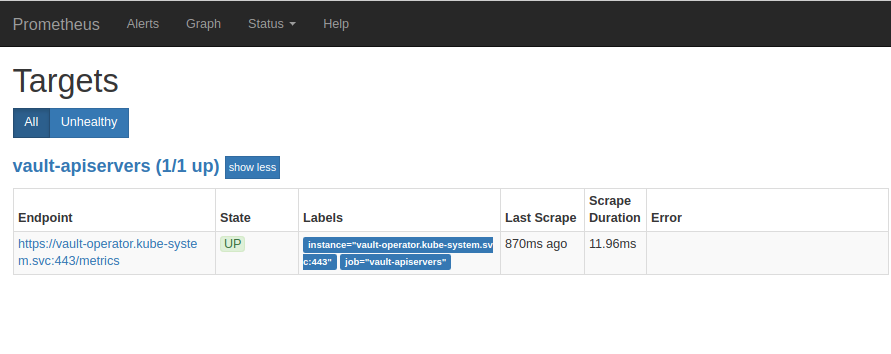
Now, we can access the dashboard at localhost:9090. Open http://localhost:9090 in your browser. You should see the configured jobs as target and they are in UP state which means Prometheus is able collect metrics from them.
Cleaning up
To uninstall Prometheus server follow this
To uninstall KubeVault operator follow this
To cleanup the Kubernetes resources created by this tutorial, run:
$ kubectl delete ns monitoring