


You are looking at the documentation of a prior release. To read the documentation of the latest release, please
visit here.
New to KubeVault? Please start here.
Monitoring KubeVault Components
KubeVault operator has native support for monitoring via Prometheus. You can use builtin Prometheus scraper or Prometheus Operator to monitor KubeVault operator. This tutorial will show you how this monitoring works with KubeVault operator and how to enable them.
Vault Server Metrics
By default the KubeVault operator will configure each vault pod to publish statsd metrics. The KubeVault operator runs a statsd-exporter container as sidecar to convert and expose those metrics in Prometheus format. Following diagram shows the logical structure of KubeVault operator monitoring flow.
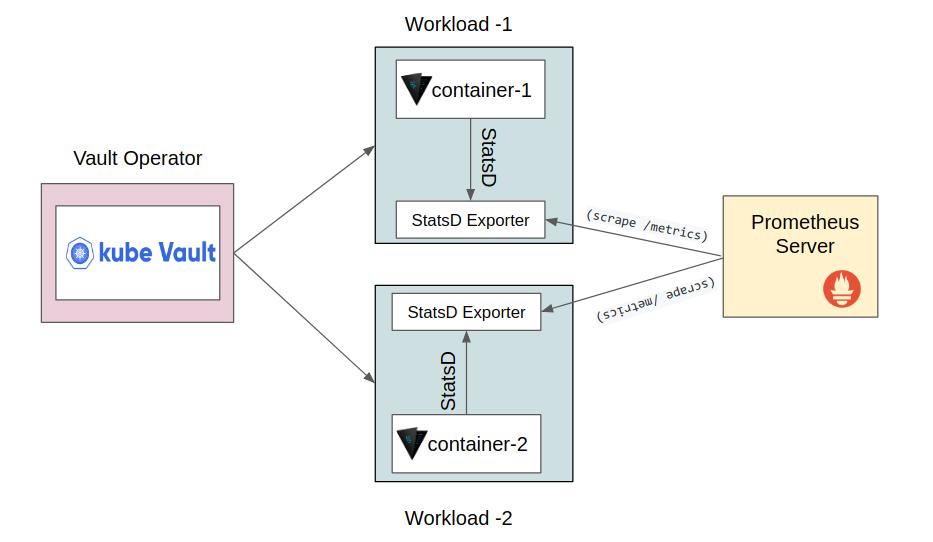
Each pod provides metrics at /metrics endpoint on port 9102. Following metrics are available for Vault server.
- vault_audit
- vault_audit_file
- vault_barrier
- vault_core
- vault_runtime
- vault_expire
- vault_merkle_flushdirty
- vault_merkle_savecheckpoint
- vault_policy
- vault_token
- vault_wal
- vault_rollback_attempt
- logshipper_streamWALs
- replication
- database
- database_error
- database_name
- database_named_error
- vault_storage_backend
- vault_provider_lock
- vault_consul
- vault_route
- vault_expire_num_leases
- vault_runtime_alloc_bytes
- vault_runtime_free_count
- vault_runtime_heap_objects
- vault_runtime_malloc_count
- vault_runtime_num_goroutines
- vault_runtime_sys_bytes
- vault_runtime_total_gc_pause_ns
- vault_runtime_total_gc_runs
- vault_runtime_gc_pause_ns
KubeVault Operator Metrics
You can enable monitoring for the KubeVault operator while installing or upgrading the operator. You can chose which monitoring agent to use for monitoring. KubeVault operator will configure respective resources accordingly. Here are the list of available flags and their usage:
| Script Flag | Helm Values | Acceptable Values | Default | Description |
|---|---|---|---|---|
--monitoring-agent | monitoring.agent | prometheus.io/builtin or prometheus.io/coreos-operator | none | Specify which monitoring agent to use for monitoring KubeVault operator. |
--monitor-operator | monitoring.operator | true or false | false | Specify whether to monitor KubeVault operator. |
--prometheus-namespace | monitoring.prometheus.namespace | any namespace | same namespace as KubeVault operator | Specify the namespace where Prometheus server is running or will be deployed |
--servicemonitor-label | monitoring.serviceMonitor.labels | any label | For Helm installation, app: <generated app name> and release: <release name>. For script installation, app: vault-operator | Specify the labels for ServiceMonitor. Prometheus crd will select ServiceMonitor using these labels. Only usable when monitoring agent is prometheus.io/coreos-operator. |
Next Steps
- Learn how to monitor Vault server using built-in Prometheus from here.
- Learn how to monitor Vault server using CoreOS Prometheus operator from here.
- Learn how to use Grafana dashboard to visualize monitoring data from here.
- Learn how to monitor KubeVault operator using built-in Prometheus from here.
- Learn how to monitor KubeVault operator using CoreOS Prometheus operator from here.