


You are looking at the documentation of a prior release. To read the documentation of the latest release, please
visit here.
New to KubeVault? Please start here.
Monitoring KubeVault operator Using Prometheus Operator
CoreOS prometheus-operator provides simple and Kubernetes native way to deploy and configure Prometheus server. This tutorial will show you how to use CoreOS Prometheus operator for monitoring KubeVault operator.
Before You Begin
At first, you need to have a Kubernetes cluster, and the kubectl command-line tool must be configured to communicate with your cluster. If you do not already have a cluster, you can create one by using kind.
To keep Prometheus resources isolated, we are going to use a separate namespace to deploy Prometheus operator and respective resources.
$ kubectl create ns monitoring
namespace/monitoring created
- We need a CoreOS prometheus-operator instance running. If you already don’t have a running instance, deploy one following the docs from here.
Enable Monitoring in KubeVault operator
Enable Prometheus monitoring using prometheus.io/coreos-operator agent while installing KubeVault operator. To know details about how to enable monitoring see here
Here, we are going to enable monitoring for operator metrics.
Using Helm 3:
$ helm install vault-operator appscode/vault-operator --version v2021.10.11 \
  --namespace kube-system \
  --set monitoring.agent=prometheus.io/coreos-operator \
  --set monitoring.operator=true \
  --set monitoring.prometheus.namespace=monitoring \
  --set monitoring.serviceMonitor.labels.k8s-app=prometheus
Using Helm 2:
$ helm install appscode/vault-operator --name vault-operator --version v2021.10.11 \
  --namespace kube-system \
  --set monitoring.agent=prometheus.io/coreos-operator \
  --set monitoring.operator=true \
  --set monitoring.prometheus.namespace=monitoring \
  --set monitoring.serviceMonitor.labels.k8s-app=prometheus
Using YAML (with Helm 3):
$ helm template vault-operator appscode/vault-operator --version v2021.10.11 \
  --namespace kube-system \
  --no-hooks \
  --set monitoring.agent=prometheus.io/coreos-operator \
  --set monitoring.operator=true \
  --set monitoring.prometheus.namespace=monitoring \
  --set monitoring.serviceMonitor.labels.k8s-app=prometheus | kubectl apply -f -
This will create a ServiceMonitor crd with name vault-operator-servicemonitor in monitoring namespace for monitoring endpoints of vault-operator service. This ServiceMonitor will have label k8s-app: prometheus provided by --servicemonitor-label flag. This label will be used by Prometheus crd to select this ServiceMonitor.
Let’s check the ServiceMonitor crd using following command,
$ kubectl get servicemonitors -n monitoring vault-operator-servicemonitor -o yaml
apiVersion: monitoring.coreos.com/v1
kind: ServiceMonitor
metadata:
  creationTimestamp: "2018-12-26T11:13:25Z"
  generation: 1
  labels:
    k8s-app: prometheus
  name: vault-operator-servicemonitor
  namespace: monitoring
  resourceVersion: "32902"
  selfLink: /apis/monitoring.coreos.com/v1/namespaces/monitoring/servicemonitors/vault-operator-servicemonitor
  uid: 438a7cb5-08ff-11e9-852c-080027857726
spec:
  endpoints:
  - bearerTokenFile: /var/run/secrets/kubernetes.io/serviceaccount/token
    port: api
    scheme: https
    tlsConfig:
      caFile: /etc/prometheus/secrets/vault-operator-apiserver-cert/tls.crt
      serverName: vault-operator.kube-system.svc
  namespaceSelector:
    matchNames:
    - kube-system
  selector:
    matchLabels:
      app: vault-operator
      release: vault-operator
Here, api endpoint exports operator metrics.
KubeVault operator exports operator metrics via TLS secured api endpoint. So, Prometheus server need to provide certificate while scraping metrics from this endpoint. KubeVault operator has created a secret named vault-operator-apiserver-certs with this certificate in monitoring namespace as we have specified that we are going to deploy Prometheus in that namespace through --prometheus-namespace flag. We have to specify this secret in Prometheus crd through spec.secrets field. Prometheus operator will mount this secret at /etc/prometheus/secrets/vault-operator-apiserver-cert directory of respective Prometheus pod. So, we need to configure tlsConfig field to use that certificate. Here, caFile indicates the certificate to use and serverName is used to verify hostname. In our case, the certificate is valid for hostname server and vault-operator.kube-system.svc.
Let’s check secret vault-operator-apiserver-cert has been created in monitoring namespace.
$ kubectl get secret -n monitoring -l=app.kubernetes.io/name=vault-operator
NAME                            TYPE                DATA   AGE
vault-operator-apiserver-cert   kubernetes.io/tls   2      8m27s
Also note that, there is a bearerTokenFile field. This file is token for the serviceaccount that will be created while creating RBAC stuff for Prometheus crd. This is required for authorizing Prometheus to scrape KubeVault operator API server.
Now, we are ready to deploy Prometheus server.
Deploy Prometheus Server
In order to deploy Prometheus server, we have to create Prometheus crd. Prometheus crd defines a desired Prometheus server setup. For more details about Prometheus crd, please visit here.
If you are using a RBAC enabled cluster, you have to give necessary permissions to Prometheus. Check the documentation to see required RBAC permission from here.
Create Prometheus:
Below is the YAML of Prometheus crd that we are going to create for this tutorial,
apiVersion: monitoring.coreos.com/v1
kind: Prometheus
metadata:
  name: prometheus
  namespace: monitoring
  labels:
    k8s-app: prometheus
spec:
  replicas: 1
  serviceAccountName: prometheus
  serviceMonitorSelector:
    matchLabels:
      k8s-app: prometheus
  secrets:
  - vault-operator-apiserver-cert
  resources:
    requests:
      memory: 400Mi
Here, spec.serviceMonitorSelector is used to select the ServiceMonitor crd that is created by KubeVault operator. We have provided vault-operator-apiserver-cert secret in spec.secrets field. This will be mounted in Prometheus pod.
Let’s create the Prometheus object we have shown above,
$ kubectl apply -f https://github.com/kubevault/kubevault/raw/v2021.10.11/docs/examples/monitoring/vault-operator/prom-coreos-crd.yaml
prometheus.monitoring.coreos.com/prometheus created
Prometheus operator watches for Prometheus crd. Once a Prometheus crd is created, Prometheus operator generates respective configuration and creates a StatefulSet to run Prometheus server.
Let’s check StatefulSet has been created,
$ kubectl get statefulset -n monitoring
NAME                    READY   AGE
prometheus-prometheus   1/1     31m
Check StatefulSet’s pod is running,
$ kubectl get pod prometheus-prometheus-0 -n monitoring
NAME                      READY   STATUS    RESTARTS   AGE
prometheus-prometheus-0   3/3     Running   1          31m
Now, we are ready to access Prometheus dashboard.
Verify Monitoring Metrics
Prometheus server is running on port 9090. We are going to use port forwarding to access Prometheus dashboard. Run following commands on a separate terminal,
$ kubectl port-forward -n monitoringprometheus-prometheus-0 9090
Forwarding from 127.0.0.1:9090 -> 9090
Forwarding from [::1]:9090 -> 9090
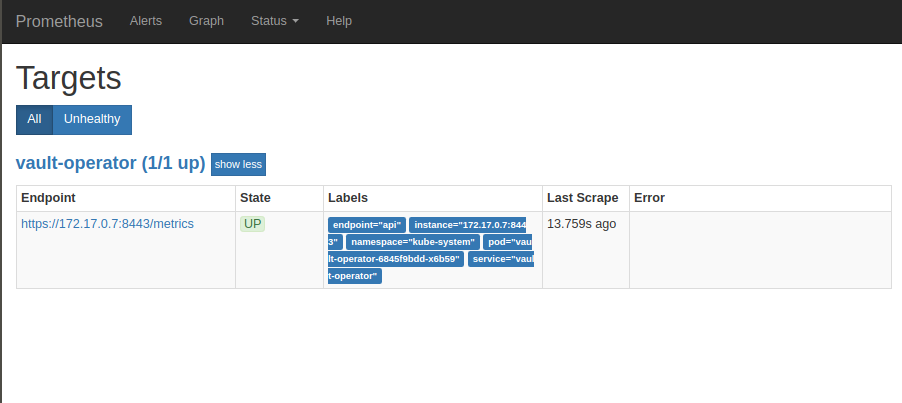
Now, we can access the dashboard at localhost:9090. Open http://localhost:9090 in your browser. You should see the configured jobs as target and they are in UP state which means Prometheus is able collect metrics from them.
Cleaning up
To uninstall KubeVault operator follow this.
To cleanup the Kubernetes resources created by this tutorial, run:
# cleanup Prometheus resources
kubectl delete -n monitoring prometheus prometheus
kubectl delete -n monitoring secret vault-operator-apiserver-cert

$ kubectl delete ns monitoring